This numerical test is devoted to reproduce a real meteotsunami event that occurred in the Gulf of Mexico (GoM) in 2010. It is mainly extracted from the studies initiated and conducted by the NOAA in 2020 for the National Tsunami Hazard Mitigation Program (NTHMP), with final report published in 2022 [1]. These are included in the framework of meteotsunami guidelines and best practices for testing meteotsunamis numerical simulations. The 2010 event was driven by a dry season storm, where low pressure systems usually move eastward and squall lines develop ahead of cold fronts [2]. This particular squall line came off the Florida coast near Panama City and moved toward southeast along the isobar of the southwestern Florida shelf, triggering a 1m wave height long wave that due to Proudman resonance provoked inundations in Clearwater Beach, Florida. In order to reproduce the event, both synthetic and real data are used. On the one hand, real bathymetry data has been downloaded from the global relief model ETOPO1 (https://maps.ngdc.noaa.gov/viewers/wcs-client/) at 15 arc-seconds resolution (≈ 450m). Figure 1 shows the area covered by this topobathymetry. On the other hand, an idealized analytic 2D pressure profile is moved along the traveling path from point A = (−85.107º, 30.7470º) to B = (−81.562º, 23.4480º) at a speed of U = 20m/s; taking about 13.5h to travel that distance. The analytical expression of the atmospheric disturbance in decimal degrees units is defined as
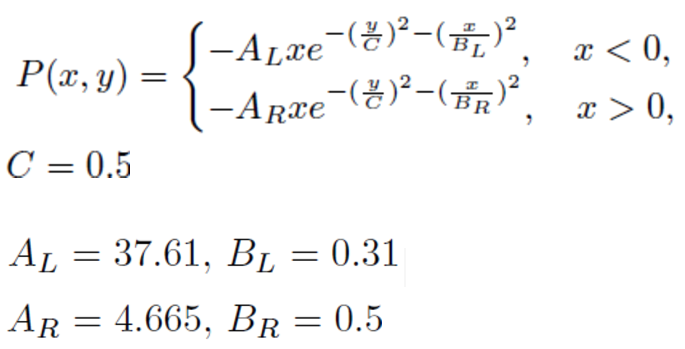
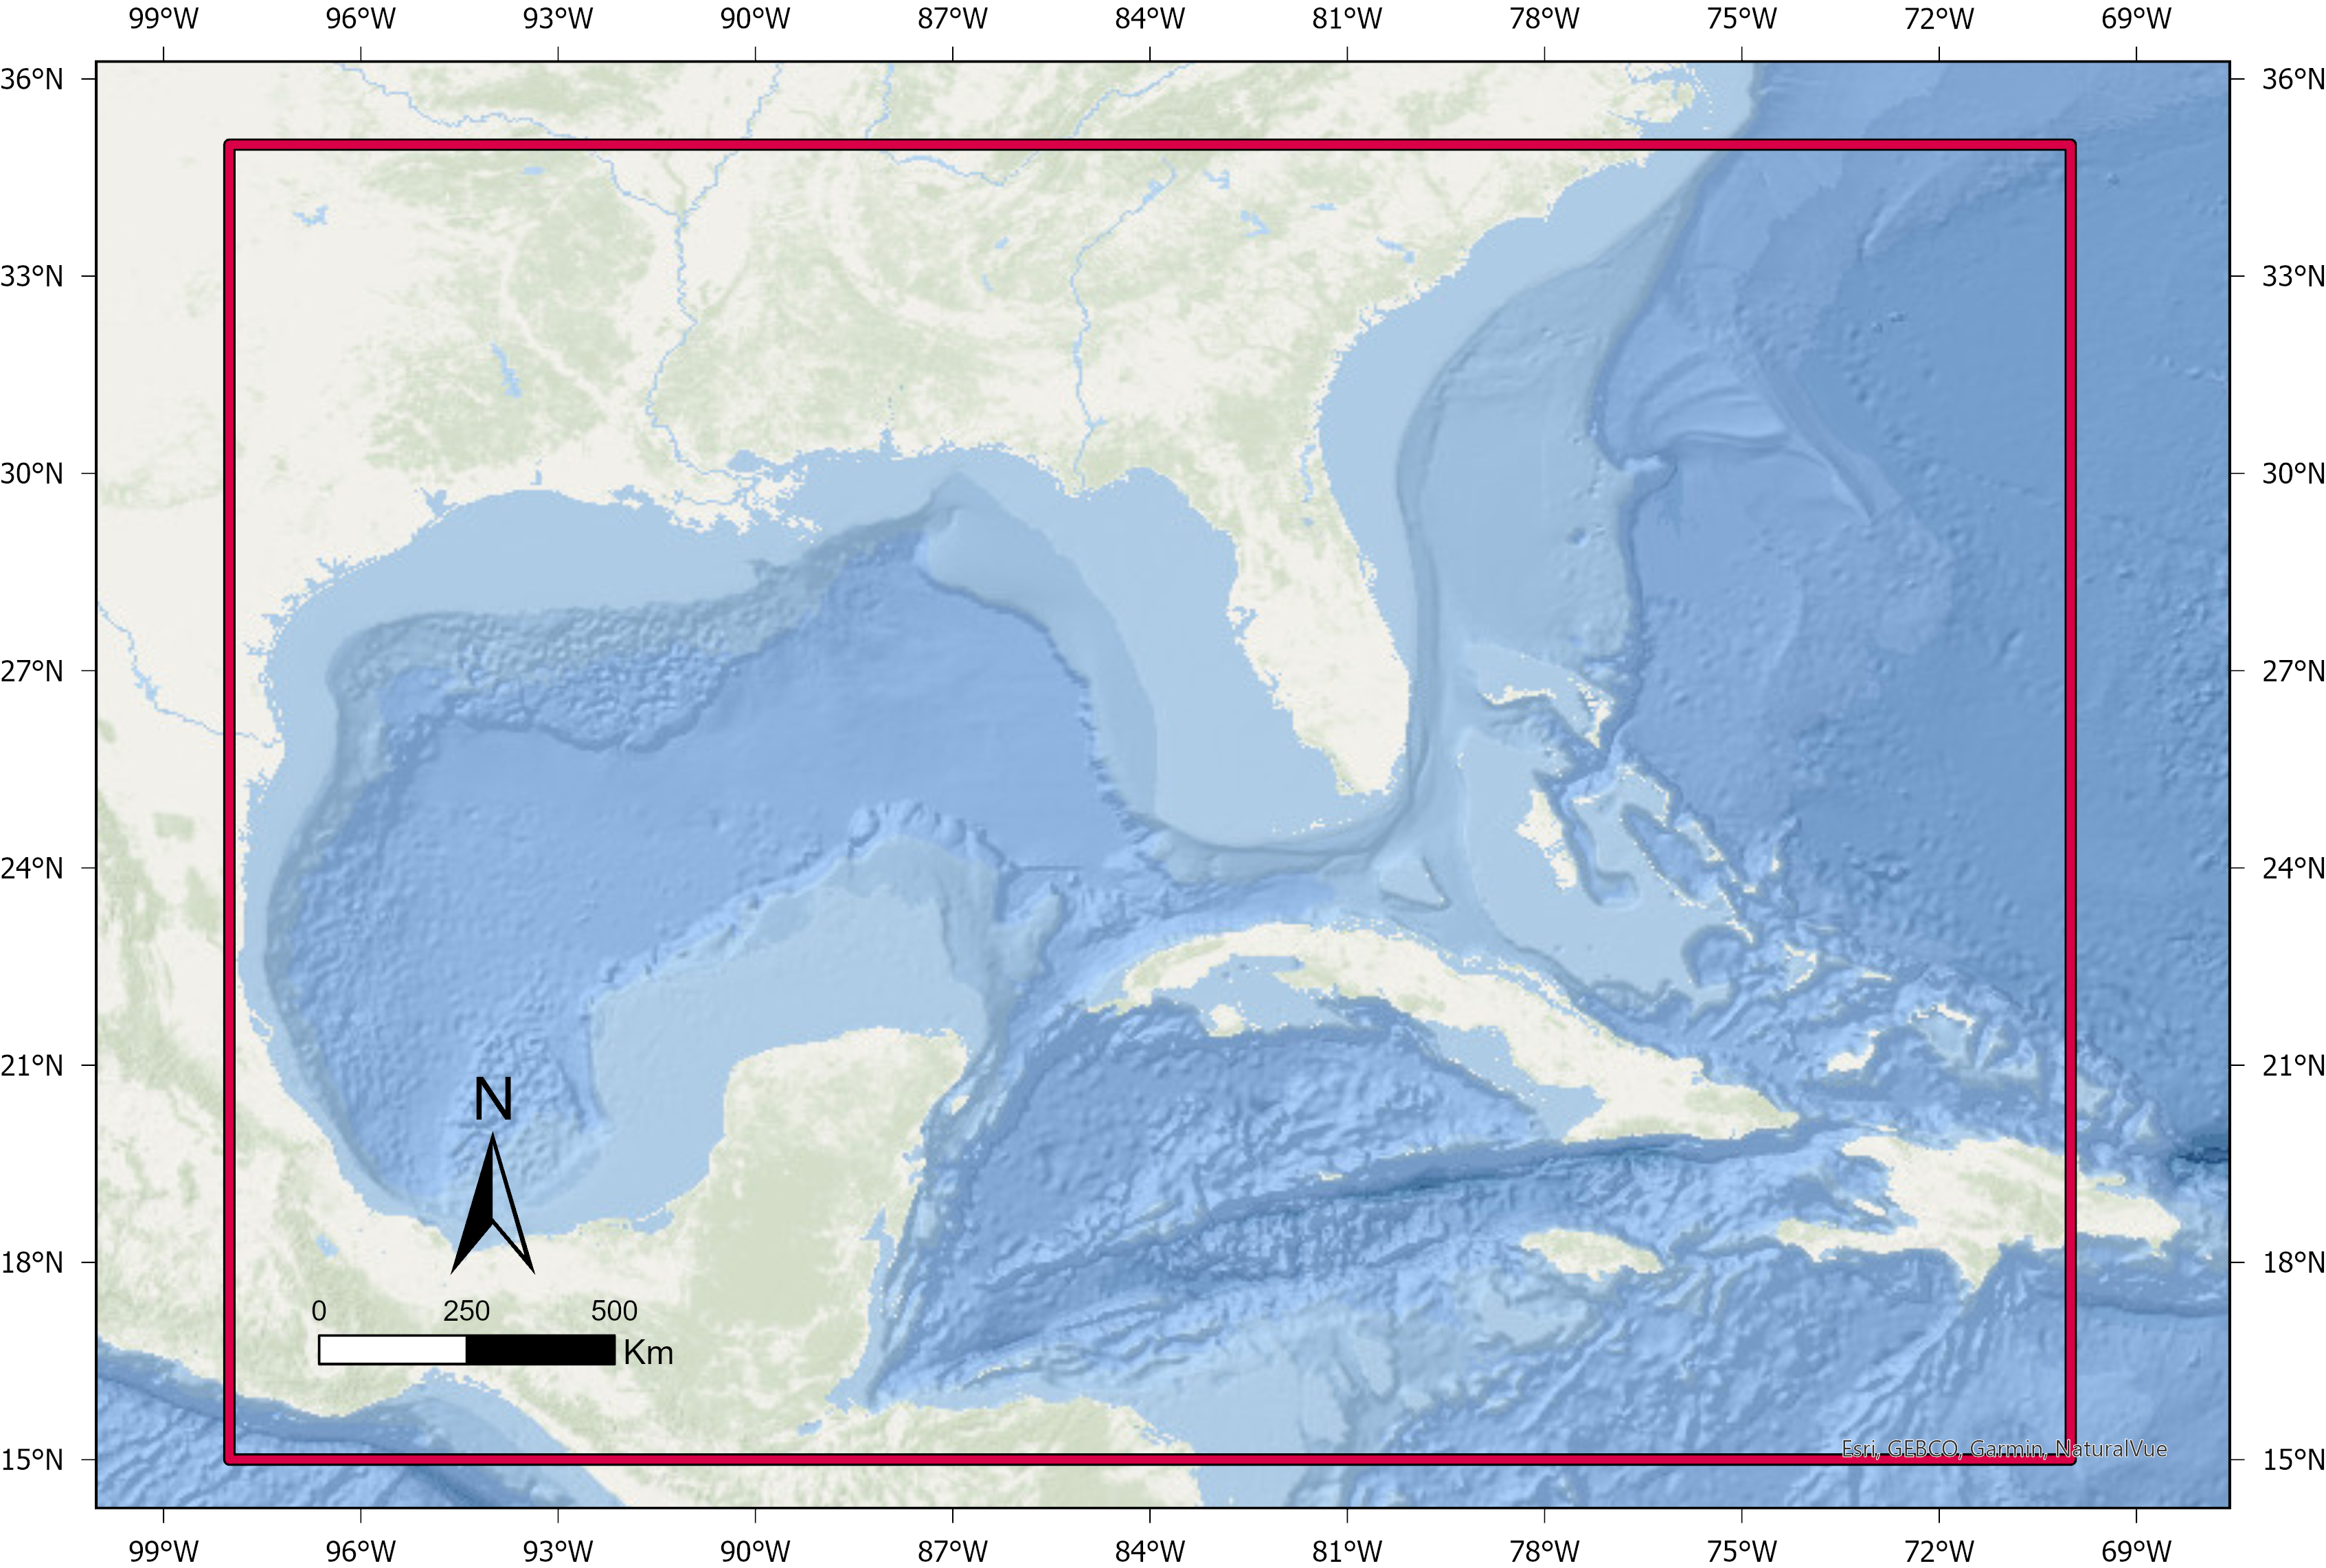 Fig. 1. Region of interest for the meteotsunami simulation test case. Red rectangle determines the area covered by the global relief model ETOPO1 downloaded from the NOAA database at 15 arc-seconds spatial resolution.
This pressure profile has a maximum of 5 hPa and a minimum of −1 hPa (see Figure 2).
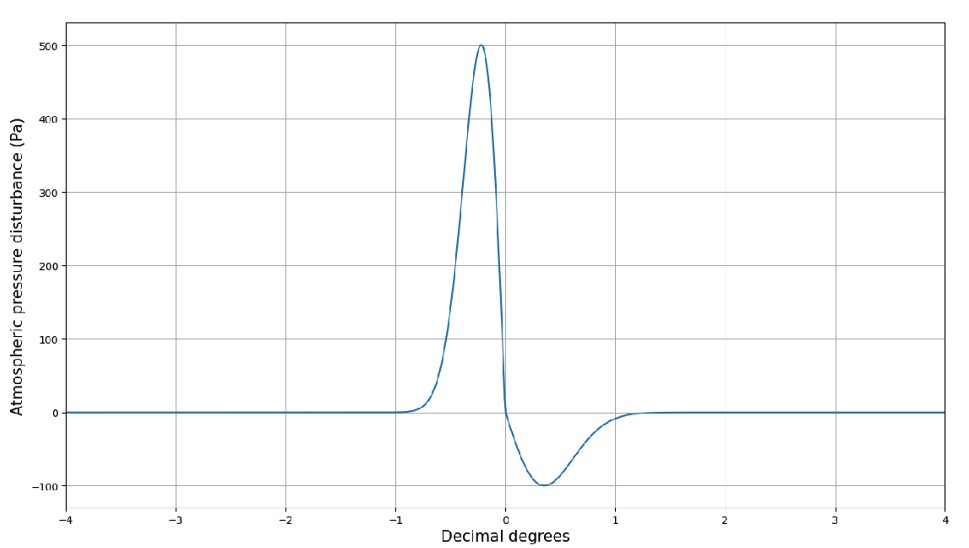 Fig. 2. Cross section at y = 0 of the analytic pressure (5.9). It reaches a maximum of 5 hPa and a minimum of −1 hPa.
Additionally, in order to better reproduce the atmospheric disturbance pattern, a curvature has been added to the pressure profile using a stereographic projection to the circular section spanned by to concentric circumferences of radius 8º and 11º. Then, the resulting pressure is centered around the starting point A and rotated to face towards point B. Figure 1 exhibits the initial simulation configuration.
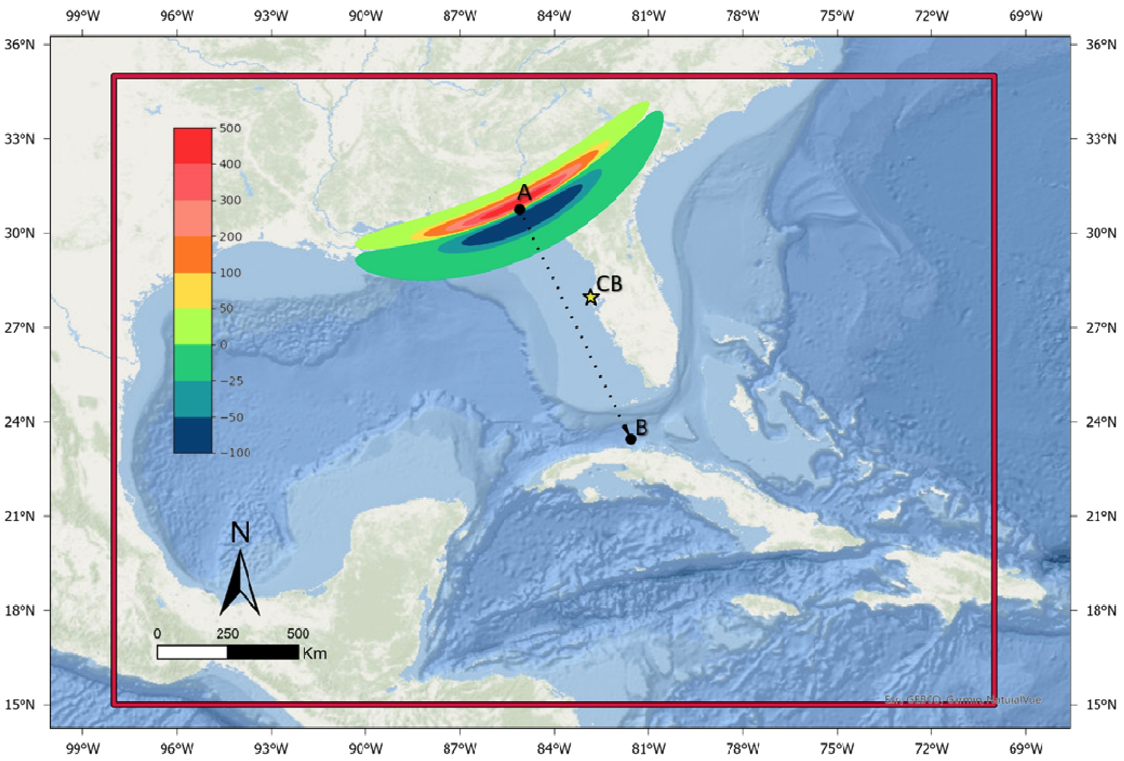 Fig. 3. Initial condition setup for the meteotsunami simulation. Pressures moves from point A to point B. Dashed line represents the traveling path. Yellow star marker (CB) is the location of Clearwater Beach, where real tide gauge data are available and time series are retrieved.
The simulation is performed using constant manning bottom friction of τ = 0.025 sm1/3 in the rectangular domain [−98º,−70º]×[15º, 35º], and using the WGS84 geographic reference system (epsg: 4326). The number of volumes is 6, 720 × 4, 800 = 32, 256, 000 and simulation time is set to 20 h. A wet and dry technique has been applied. Finally, Figure 4 shows a time series retrieved at Clearwater Beach location (−82.83167º, 27.9783º), where real tide gauge measures are available. An overall good match is achieve, being able to capture the recorded extreme peak values. Besides, the arrival time of the greater wave around 6-7h of simulation time is almost correctly captured. These results are in good agreement with those exhibited in the NOAA report [1]. Nevertheless, further tweaking and adjustment of the constants that define the pressure disturbance field would likely lead to enhanced results regarding the arrival time.
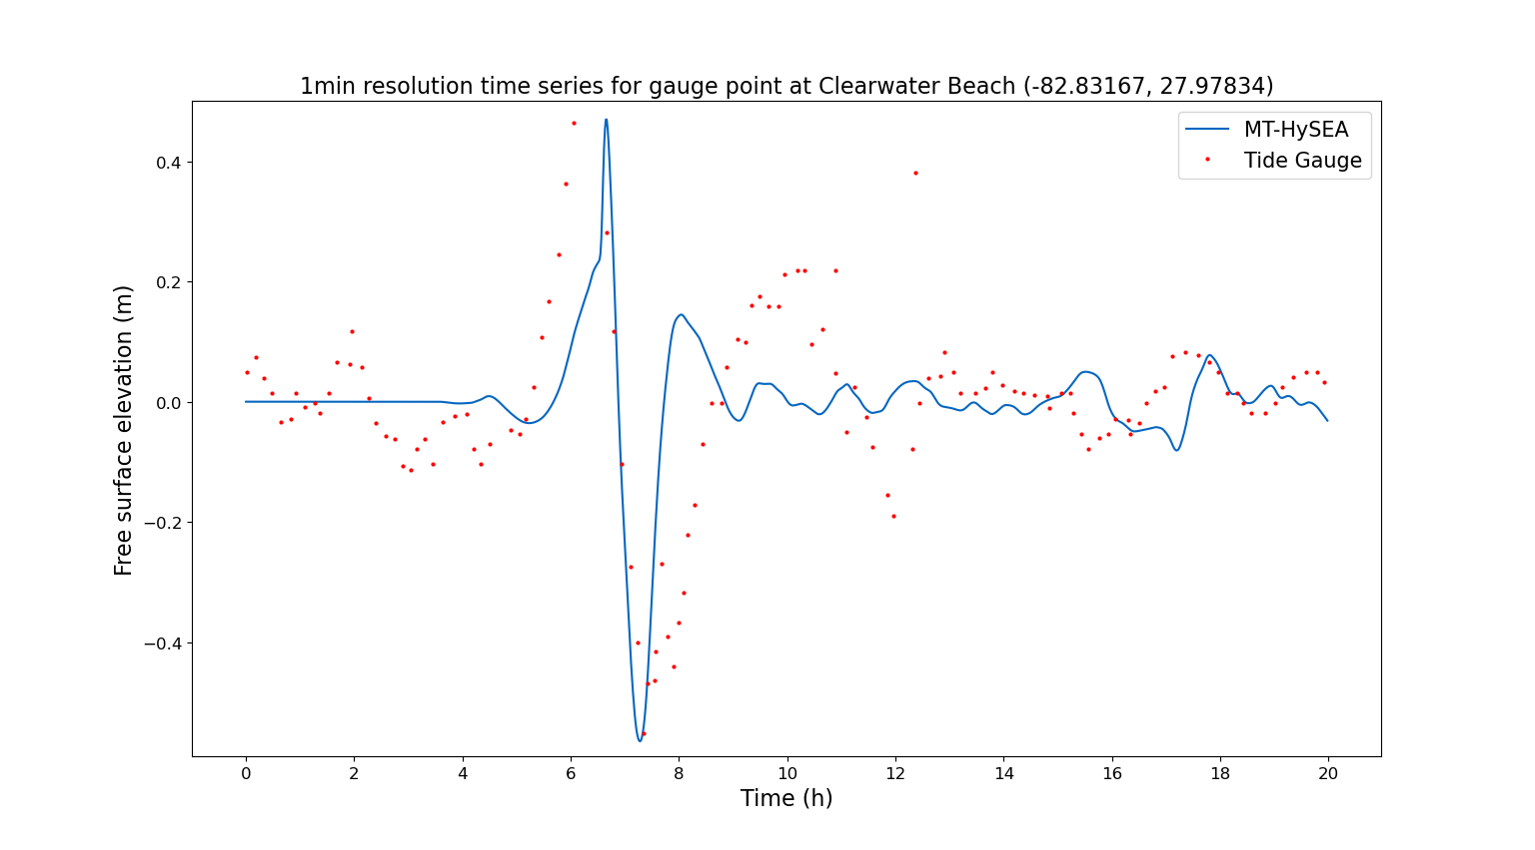 Fig. 4. Time series retrieved at Clearwater Beach. Red dots are real data gathered from a tide gauge.
References:
[1] J. J. Horrillo, W. Cheng, A. Jose, and Y. Shang, Tsunami inundation maps development and continuation of the meteotsunami characterization, 2022.
[2] M. Olabarrieta, A. Valle-Levinson, C. J. Martinez, C. Pattiaratchi, and L. Shi, Meteotsunamis in the northeastern Gulf of ;exico and their possible link to EL Niño Southern Oscillation, Natural Hazards, 88 (2017), pp. 1325–1346, https://doi.org/10.1007/s11069-017-2922-3.


